Cancer Curation Platform
Business need
DFCI is unique among cancer institutes for its 50:50 split between clinical care and research. Much of the research relies on data collected through clinical care and stored in the EHR, but a crucial and large portion of this data is not analyzable
Goal
Create a system that enables the curation of standardized, structured, and high-quality data from patient electronic health records (EHR). Provide a single institute-wide platform into which patient records can be curated.
Timeline
3+ Years, 2017-2020
Scope & my role
As Product Designer (plus hybrid roles), I steered this project from concept through execution.
Filled in as Product Owner during transition phases, establishing agile workflows
Defined data needs and authored a central Data Dictionary, learning Python to support data logic
Built the design system and front-end implementation (CSS → SCSS)
Partnered closely with stakeholders, clinicians, curators, leadership, and engineers throughout
In this case study, I’ll walk through both the Curation Platform I designed—an internal tool for structuring cancer-related EHR data—and an example of how that structured data powers downstream value, demonstrated through PRISSMM™, a patient journey visualization system.
The original PRISSMM™ system was developed by Dr. Deborah Schrag while at Dana-Farber. It has since been enhanced and adopted by Memorial Sloan Kettering (MSK), which now offers it under commercial and academic licenses.
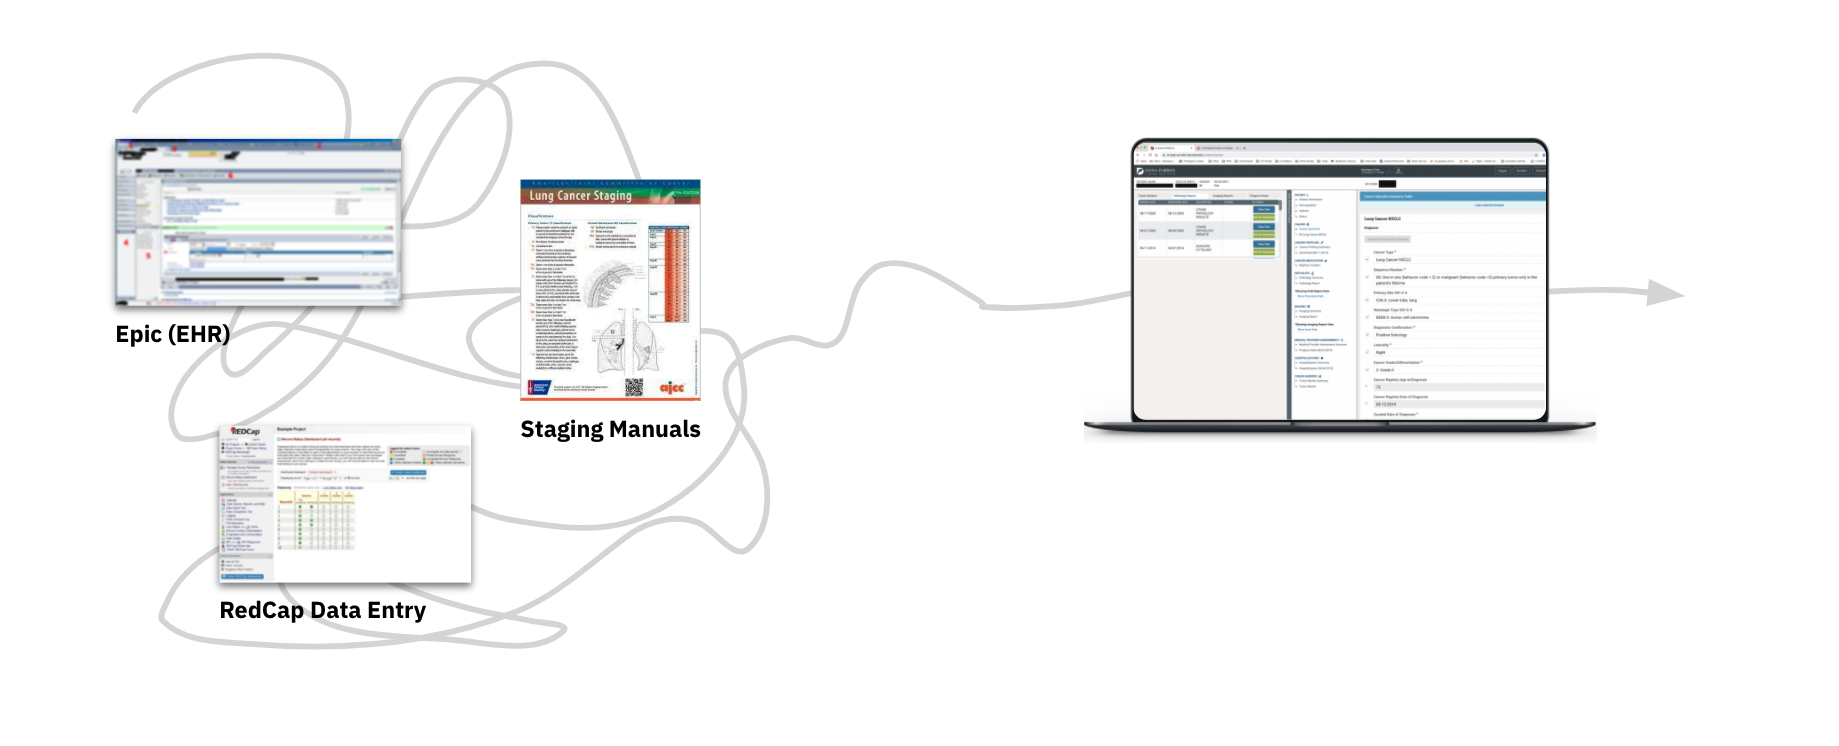
The landscape: messy data & research friction

Structured data
Structured data is analyzable, like billing diagnosis codes.
Structured, poor quality
Other data like medications or treatment plans suffer from missingness and other quality issues

Unstructured free-text data
Narrative notes—such as progress reports, pathology findings, and imaging summaries—are stored as unstructured text within the EHR. This data is often disorganized and not machine-readable. Yet, it holds some of the most critical insights: clinical outcomes, or how patients respond to treatment over time.
Because outcomes are often trapped in not analyzable free-text data, a lot of manual effort is required to do research efficiently at scale despite the large amount of data Dana-Farber has.
The application:
Curation Platform
The user: cancer curators

Cancer data is curated by Clinical Research Coordinators (CRCs), usually recent grads planning to enter medicine or research.
They rely on the EPIC EHR system to find patient information, but EPIC is widely seen as hard to navigate—especially for deep data review.
To capture details, CRCs manually transfer data into tools like Excel or REDCap. This process is slow, repetitive, and often leads to inconsistent or duplicated work across siloed systems.
A streamlined interface for data curators
The curation platform makes it easier to work with EHR data by providing helpful prompts and a user-friendly interface—replacing scattered, manual data entry with a more streamlined process.
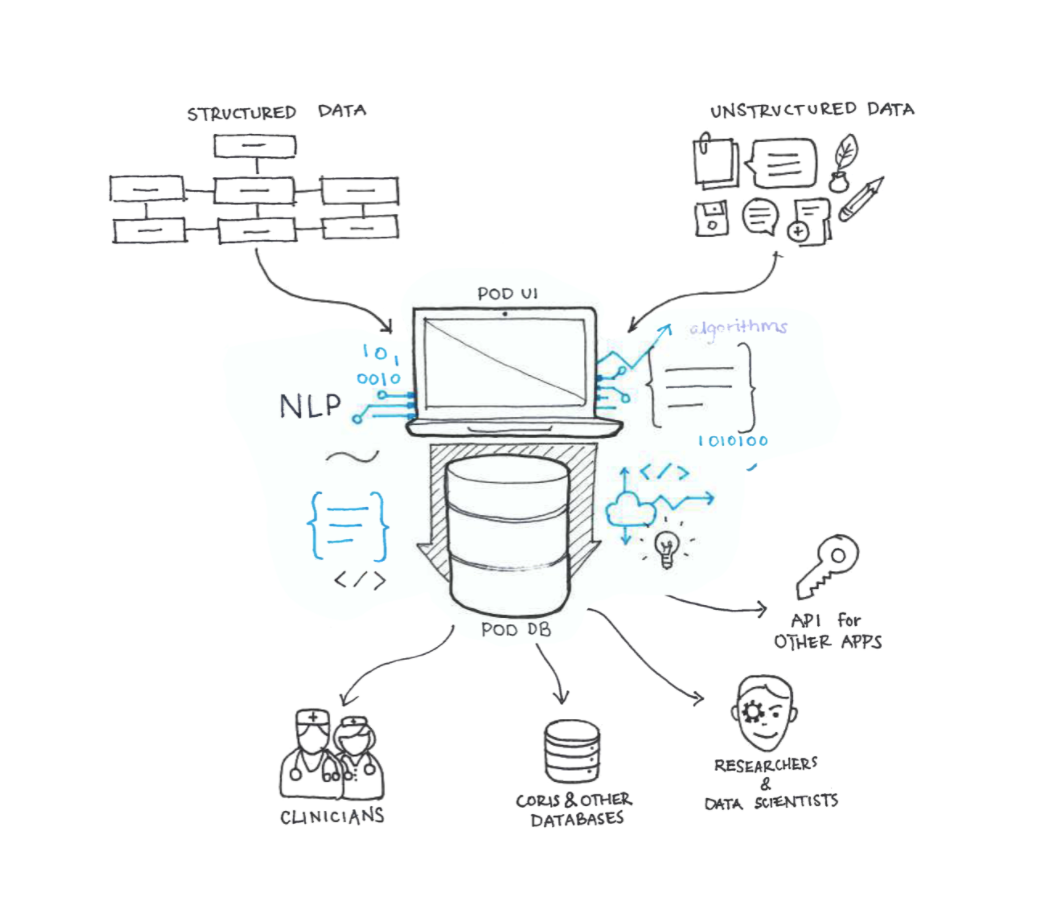
A central place for recording high quality data
Curation Platform strategy
Curators extract key information from the electronic data warehouse and save it into a central database, making high-quality data accessible to both researchers and clinicians.
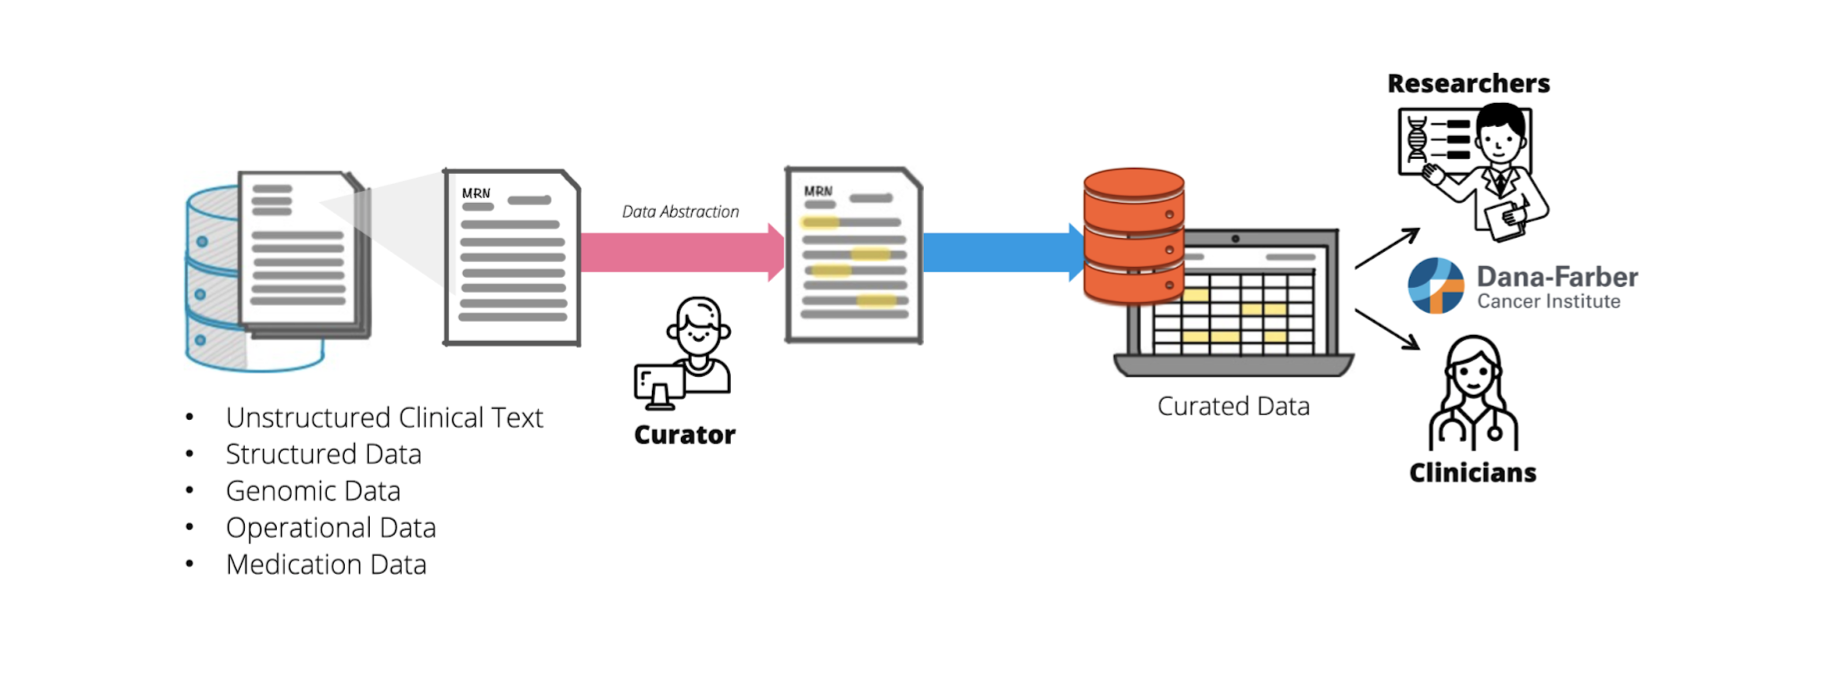
Curation Platform interface
Curators review free-text notes on the left and enter structured data on the right. When available, source data is auto-filled and can be quickly reviewed and accepted.
Each field includes guidance to support accurate and consistent entry.
Team leads or PIs can step in to answer questions or review entries for quality assurance.

The impact:
Patient journey visualization with PRISSMM™

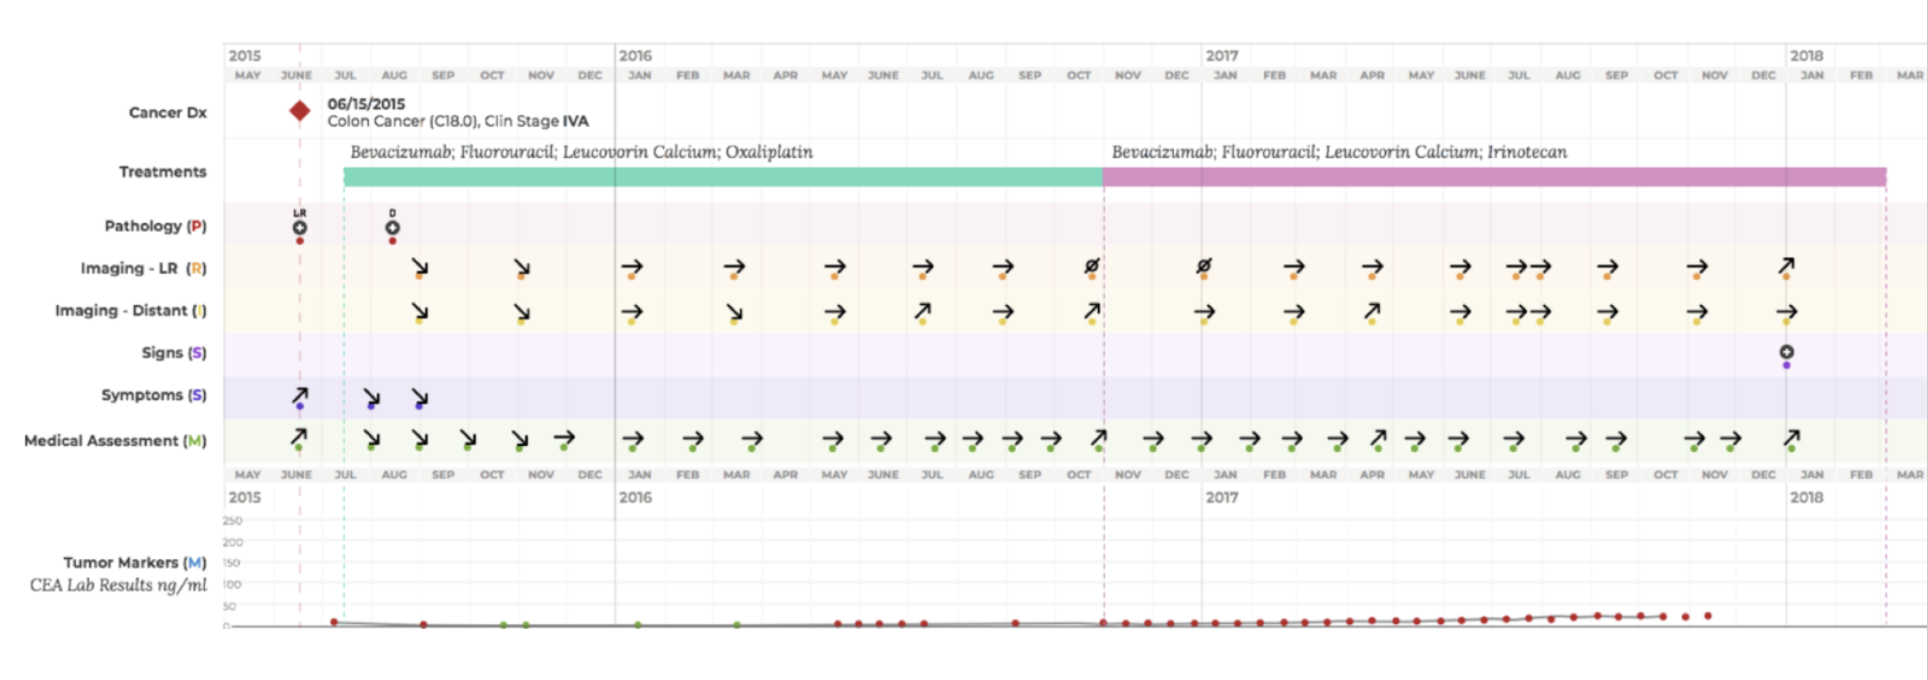
Patient cancer journeyDoctors often have to reconstruct the story—when the patient was diagnosed, how the diagnosis was made, what treatments they received, when those treatments started or changed, and whether or when the disease progressed.
This information is buried across multiple unstructured reports, making it difficult and time-consuming to piece together.
Doctors often need to answer a key question:
How many months did the patient remain stable after diagnosis?
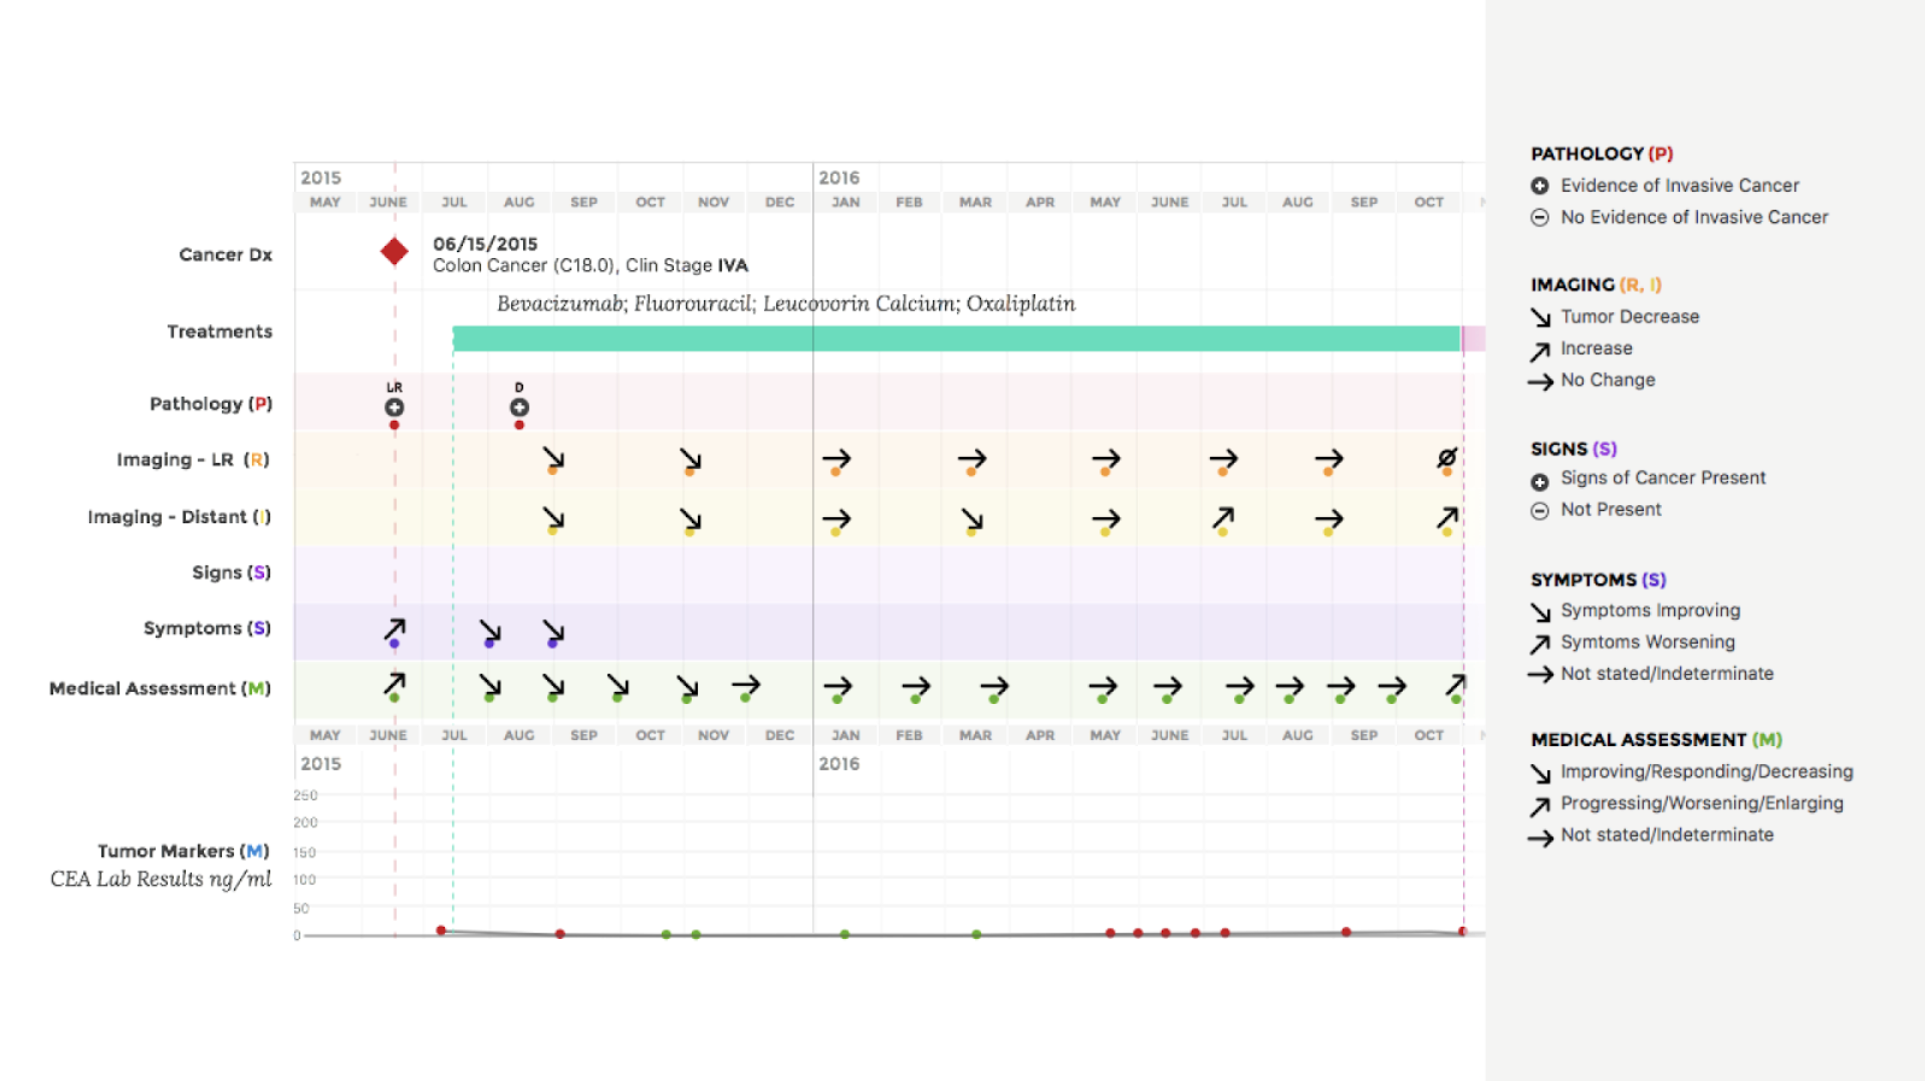
This metric—known as Real-World Progression-Free Survival—isn’t recorded in one place. It must be inferred from scattered notes and reports.
Using curated data from the Curation Platform, I created a visualization that tells this story clearly. I used Python and Plotly to generate the chart from real patient data, then styled it in Sketch to match clinical communication needs.
With this visual, a doctor can understand a patient’s treatment timeline in minutes—saving significant time compared to searching through raw EHR records.
Impact
The Curation Platform was used to curate six patient cohorts as part of the AACR Project GENIE Biopharma Collaborative (GENIE BPC)—a multi-institution effort to build a pan-cancer repository of structured clinical and genomic data.
In 2019, a group of biopharma companies pledged $36 million to GENIE BPC to access curated data from an estimated 50,000 de-identified patients.
The visualization I created using curated data from the platform was featured in Dr. Deborah Schrag’s 2018 ASCO presentation, demonstrating the clinical value of structured outcomes data.
The Curation Platform supported early abstraction efforts that aligned with the goals of the GENIE BPC initiative. That work—and the use of the PRISSMM™ framework—was later described in a 2022 JCO Clinical Cancer Informatics publication documenting GENIE BPC’s quality assurance approach:
→ “The GENIE BPC project builds on AACR Project GENIE, leveraging the PRISSMM framework to curate phenomic information from the EHR…”
→ Read the full paperWhat began as a moonshot—developed by a small, scrappy team—grew into a robust, production-grade system.
More projects
-
BioSample Data Explorer
-
Broad's COVID-19 Sequencing Dashboard
-
DFCI Patient Statusboard